Disclaimer

Please, proceed carefully following the tips published in this blog, specially when Main Power is involved. I'm not responsible for any damages caused by what is written in this blog.
Thank you
Showing posts with label owl. Show all posts

Monday, 28 August 2017

Home Automation System - MQTT and RF433 to monitor photovoltaic production


Now I will try to integrate my RF433 Wireless Receiver (built on Arduino with Ethernet Shield) with MQTT, just to acquire my photovoltaic production data in my future Home Automation System

I don't write nothing more about my acquisition system; this is my old post about that:

http://domoticsduino.blogspot.com/2017/02/rf-433-mhz-data-sniffing.html

Now I would like to transmit data to my MQTT broker, for the future integration with OpenHAB

So, I have to edit the code of the Arduino sketch and let it to publish messages to the MQTT broker. In this time, the receiver publishes data to a HTTP REST Web Service

Well, using Arduino IDE (the same thing used for the SONOFF firmware upload), I open the sketch and edit the code.

I omit the technical details about the code because it's not the purpose of this post, but if you are interested in it, write me an email; I will be happy to share my code with you.

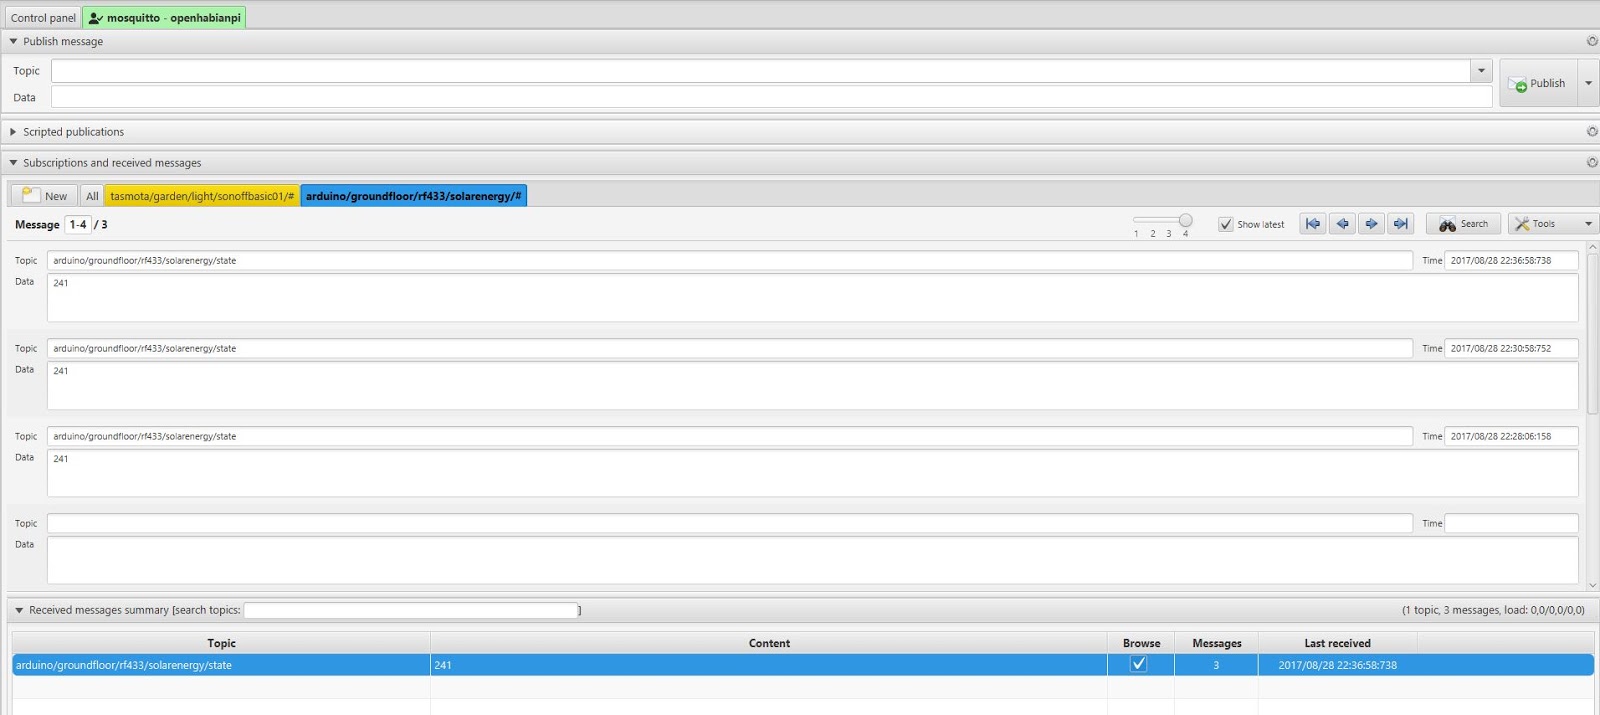
I chose the following MQTT topic:

arduino/groundfloor/rf433/solarenergy/state

I followed the same naming convention as the SONOFF :

[device]/[zone]/[type]/[data id]/state

The content of the message is simply the value of the production in Watt.

Here are the published messages, through mqtt-spy:


And here is the receiver:


Currently it's "mute", but the next step would be adding a led to monitor its status and eventually some environmental sensor...

Stay tuned...


Thursday, 10 March 2016

Data acquisition - Let's take a look...

Finally I'm ready to show acquired data on the web.

I developed a small PHP web application which shows data and charts through the browser.

Some details:

- PHP 5 programming language and HTML5 rendering
- MARIADB database engine (the independent version of MYSQL, bought by Oracle)
- Frontend developed with Bootstrap v.3 framework
- Google Charts library for charts
jQuery e jQuery-UI Javascript libraries

The User Interface is very simple; it aims to let me verify that all the systems are running fine.

I developed a simple homepage which shows a couple of charts for:

- daily photovoltaic production (link)
- last minutes of Methane Gas detection with a link to a page which shows daily data (link)

Dal grafico della produzione fotovoltaica si può notare un dato anomale...nelle ore notturne la produzione sembra essere costante e maggiore di 0 (cosa naturalmente impossibile...). A detta dell'assistenza, questo problema sembra essere dovuto alla potenza reattiva dovuta alla scarica dei condensatori dell'inverter
From the first chart you can see a strange thing...during the night it seems that photovoltaic production is positive...(impossible, isn't it?). It is due to the reactive power caused by capacitors in the inverter.

(today was a good day...we got 2Kwp)


Under every chart you can also see the last detected data.

On this page there is an auto refresh function which lets you see the real time data.

Then I also developed a login page for future functionalities.


This web application is running on the Raspberry PI, where Apache 2 is installed.
I used a Dynamic DNS service to let this web application be on internet, through a NAT managed by my home router.

I used NO-IP service, which gives me 3 free domains. There is also a linux client application which keeps DNS updated every time my public IP will change.

Tuesday, 8 March 2016

Data acquisition - Photovoltaic production


Another kind of data I would like to acquire is the production of my photovoltaic plant, a 3 kwp plant built over my roof and made by SUNAGE 250 swiss modules and AROS SIRIO inverter.

I also received a little energy monitor tool, which allows me to verify power production through a wireless display. This display is able to store data in a little sqlite database. Through a USB connection, it lets me view and download data using a PC.

This tool is called OWL

http://www.theowl.com/energy-monitors/standalone-monitors/owl-usb/


My model is the OWL+USB CM160.

The OWL has a little bug because it also detects reactive power when the inverter is switched off (during the night for example...)

For my purpose I have to connect OWL to Raspberry. Unfortunately this is not supported and there aren't official drivers. Making some research over the internet, I found a good linux open source interface for OWL: EAGLE-OWL https://github.com/cornetp/eagle-owl

I compiled and installed this software directly into the Raspberry. It is a background process which detects the CM160 e gets the database data.

This is the shell of Raspberry where you can see the eagle-owl software and database files.


This process will run automatically on startup. Then I wrote a little php script which is able to read CM160 database file e put its data into mysql. In this way I could store all historical data which will be displayed through a web interface.

This script will run on Raspberry every minute (standard cron task).